
Community Participation in #AWP26 Conference & Bookfair
The following report compiles demographics for presenters of proposed and accepted events in the 2026 AWP Conference & Bookfair.
Consistent with data we have made public in recent years, we offer insights into the self-reported race/ethnicity, gender, sexual orientation, disability status, and age of presenters included in 2026 event proposals. AWP uses responses in the aggregate only (in general sums and percentages) for reports to our funders and members. AWP never discloses individual characteristics or identifying information in such reports, nor does AWP share individual characteristics with the subcommittee members who evaluate proposals.
Visit the How Events Are Selected page for details about how the 2026 AWP Subcommittee made their selections. AWP is grateful to the subcommittee for their hard work in assembling a balanced and inclusive schedule for the 2026 conference.
Thank you to all who took the time to provide the information presented in this report. Your participation is critical to ensuring the AWP Conference and Bookfair represents our literary community year after year. Over the next few months, we expect the distributions presented below to change slightly as some panelists step off events, either because they are committed to more than two accepted events or for other reasons, and other panelists take their place. Event organizers will select replacements. AWP limits the number of events in which any one presenter may participate to increase participation in and inclusivity of the conference.
Table Of Contents
The following headings are page navigation links. Please click the section you would like to view.
2026 Presenters Who Identified Themselves by Race or Ethnicity
2026 Not-Accepted vs. Accepted Participants by Race or Ethnicity
2026 Presenters by Race or Ethnicity, Compared to 2023–2025
2026 Presenters Who Identify Themselves by Gender
2026 Not-Accepted vs. Accepted Participants by Gender
2026 Presenters by Gender, Compared to 2023–2025
2026 Presenters Who Identified Themselves by Sexual Orientation
2026 Not-Accepted vs. Accepted Participants by Sexual Orientation
2026 Presenters by Sexual Orientation, Compared to 2023–2025
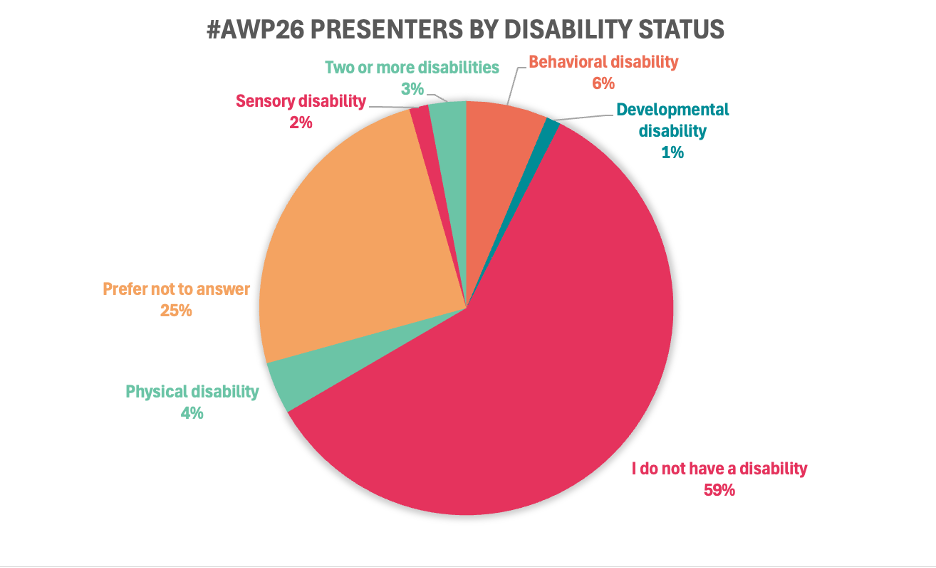
2026 Presenters Who Identified Themselves by Disability
2026 Not-Accepted vs. Accepted Participants by Disability
2026 Presenters by Disability Status, Compared to 2023–2025
2026 Presenters Who Identified Themselves by Age
2026 Not-Accepted vs. Accepted Participants by Age
2026 Presenters by Age, Compared to 2023–2025
A Note on System Transition
AWP transitioned web software systems and its database recently, and as part of this transition, response options to demographic questions have been updated. Comparisons between this year’s data and that from previous years will therefore be approximate.
The transition has also impacted response rates for the 2026 cycle, as users needed to access these new systems for the first time, reset their passwords, and update demographic information. In most cases, 2026 response rates remain statistically significant and representative. We anticipate response rates in future conference cycles to increase as users adapt to the new system.
[Community Data Report continues below]
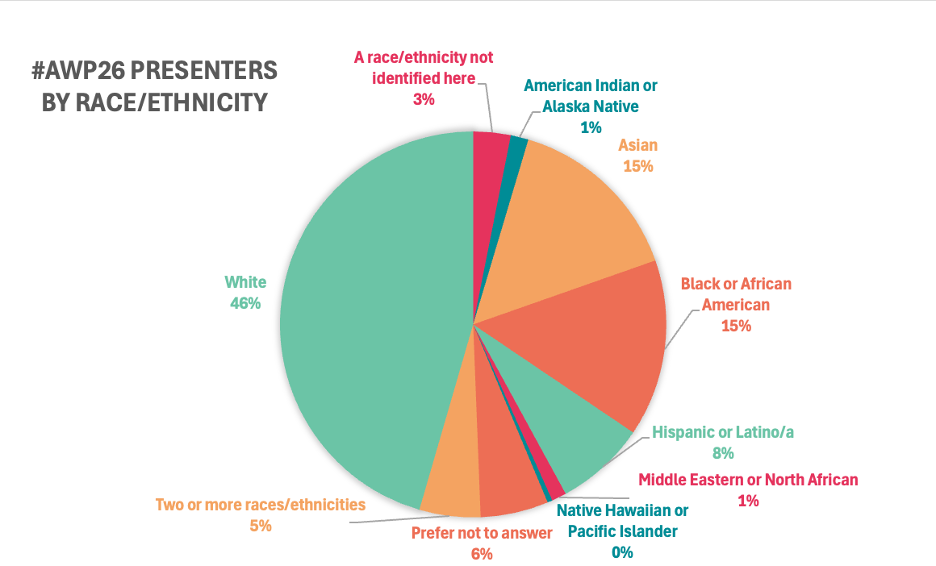
2026 Presenters Who Identified Themselves by Race or Ethnicity*
|
Race/Ethnicity |
# of Presenters |
|
|
A race/ethnicity not identified here |
38 |
|
|
American Indian or Alaska Native |
18 |
|
|
Asian |
182 |
|
|
Black or African American |
180 |
|
|
Hispanic or Latino/a |
92 |
|
|
Middle Eastern or North African |
15 |
|
|
Native Hawaiian or Pacific Islander |
5 |
|
|
Prefer not to answer |
69 |
|
|
Two or more races/ethnicities |
62 |
|
|
White |
552 |
|
|
Grand Total |
1213 |
|
* Statistics reflect an 82.3% response rate. Of 1,474 presenters, 1,213 responded to the race/ethnicity demographics question. Presenters that self-identified as a race/ethnicity not included in the survey or selected “prefer not to answer” were figured as respondents.
2026 Not-Accepted vs. Accepted Participants by Race or Ethnicity*
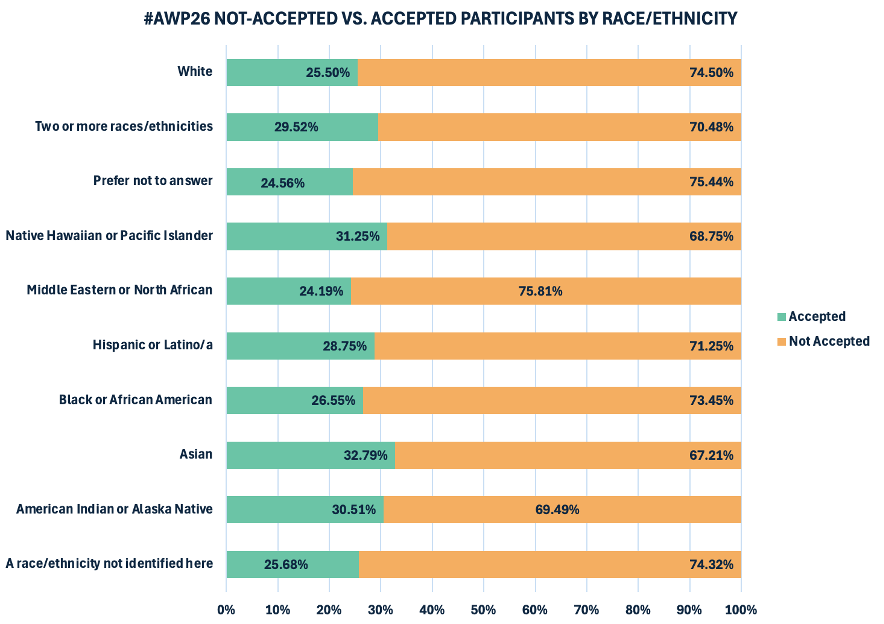
* Statistics reflect an 82.3% response rate for accepted participants (1,213 respondents out of 1,474 accepted participants) and a 78.5% response rate for not-accepted participants (3,281 respondents out of 4,176 not-accepted participants). Participants that self-identified as a race/ethnicity not included in the survey or selected “prefer not to answer” were figured as respondents.
2026 Presenters by Race or Ethnicity, Compared to 2023–2025*
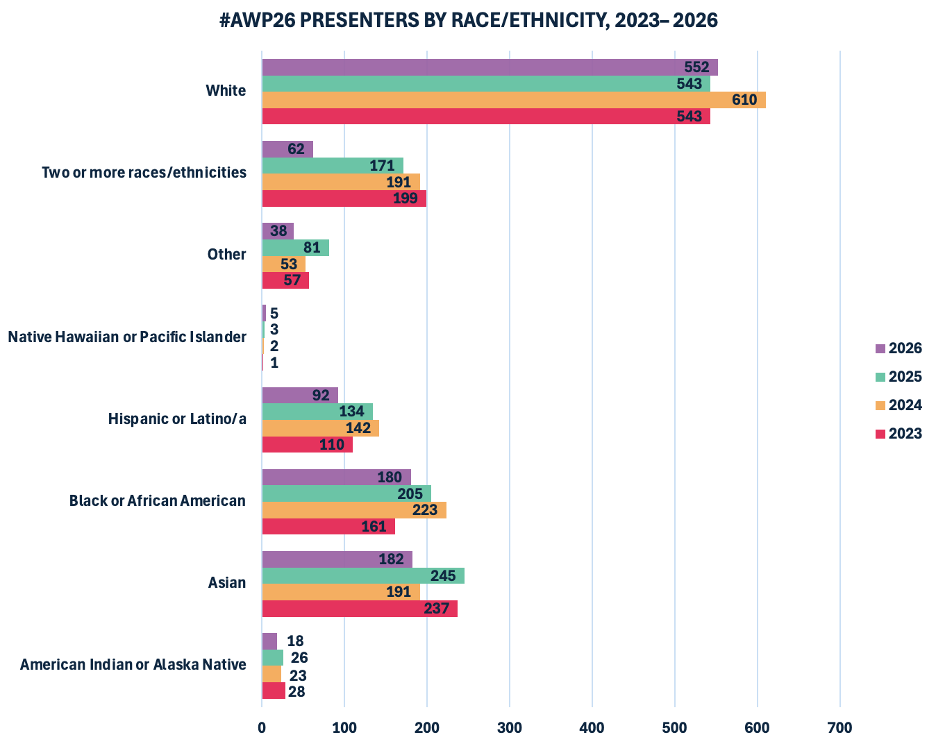
* Statistics reflect the following response rates:
82.3% response rate in 2026. See “A Note on System Transition” for more information regarding the 2026 response rate.
91.6% response rate in 2025
92.7% response rate in 2024
90.7% response rate in 2023
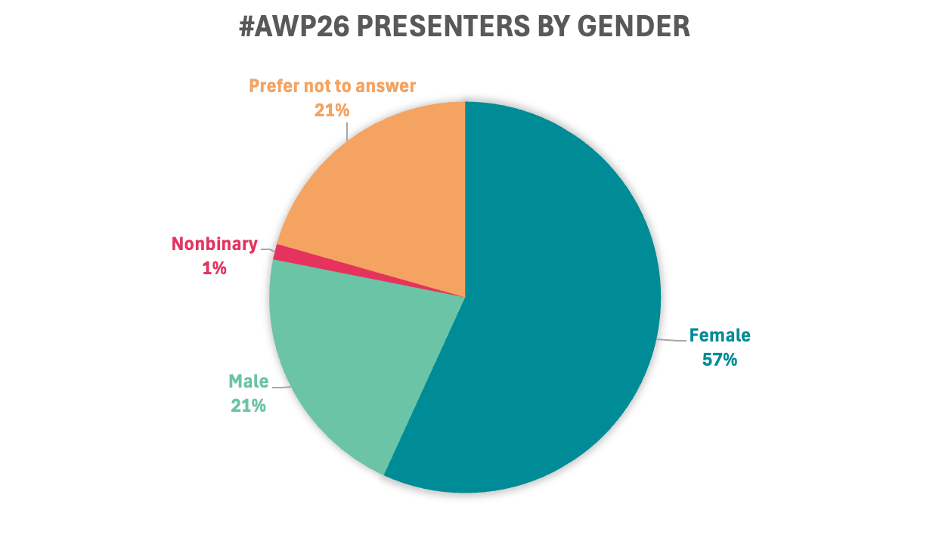
2026 Presenters Who Identify Themselves by Gender*
|
Gender |
# of Presenters |
|
Female |
662 |
|
Male |
248 |
|
Nonbinary** |
15 |
|
Prefer not to answer |
240 |
|
Grand Total |
1165 |
* Statistics reflect a 79.1% response rate. Of 1,474 presenters, 1,165 responded to the gender demographics question. Presenters that selected “prefer not to answer” were figured as respondents.
2026 Not-Accepted vs. Accepted Participants by Gender*
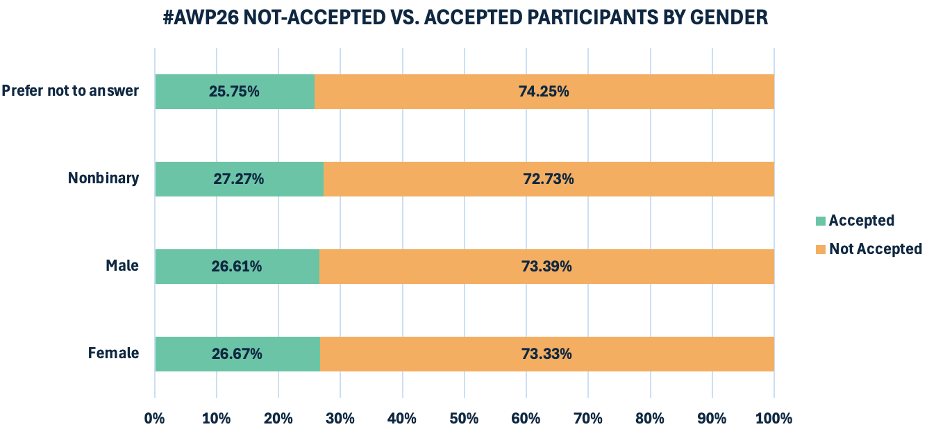
* Statistics reflect a 79.1% response rate for accepted participants (1,165 respondents out of 1,474 accepted participants) and a 77.5% response rate for not-accepted participants (3,236 respondents out of 4,176 not-accepted participants). Participants who selected “prefer not to answer” were figured as respondents.
2026 Presenters by Gender, Compared to 2023–2025*
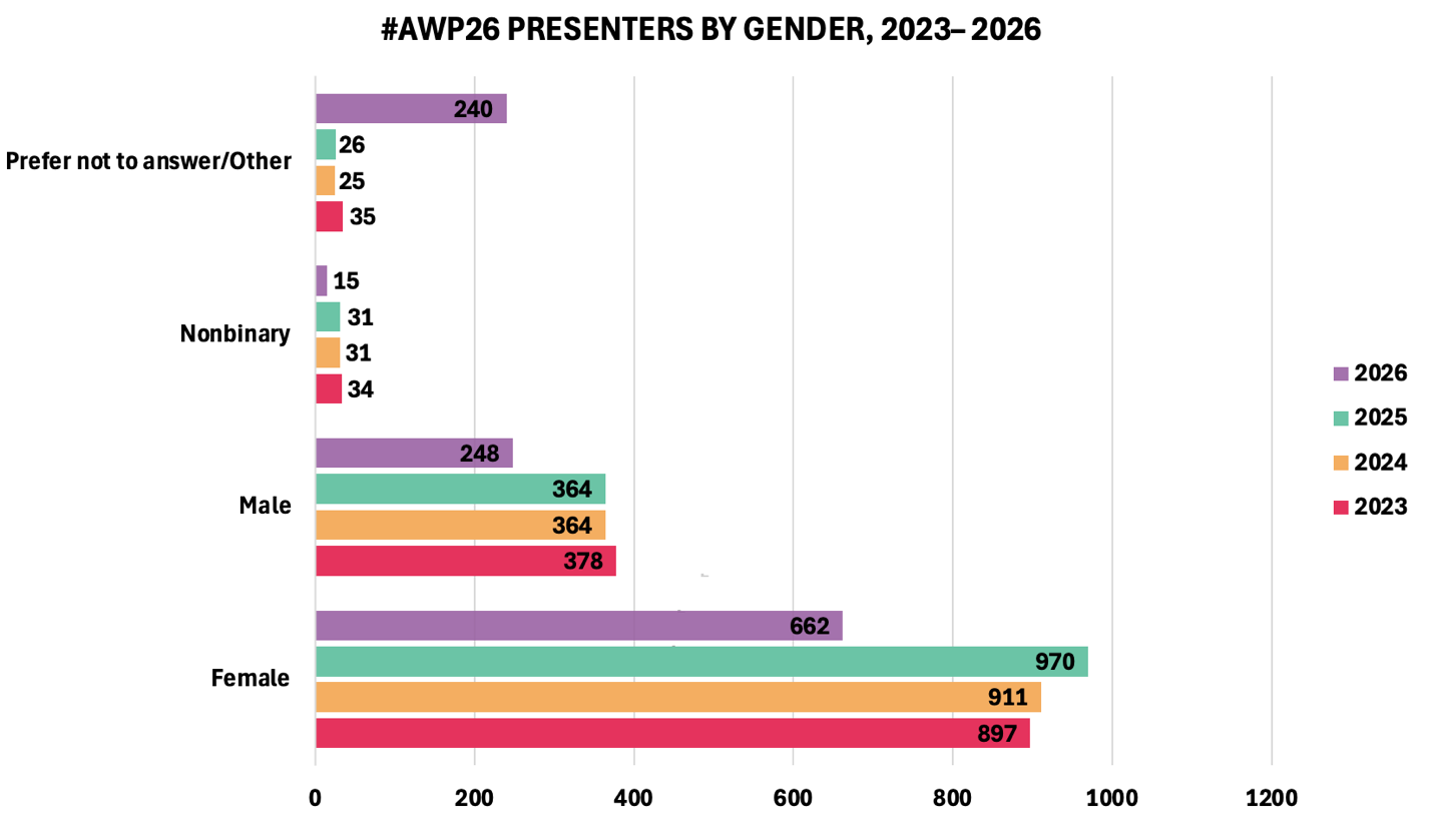
* Statistics reflect the following response rates:
79.1% response rate in 2026
98.4% response rate in 2025
95.8% response rate in 2024
95.0% response rate in 2023
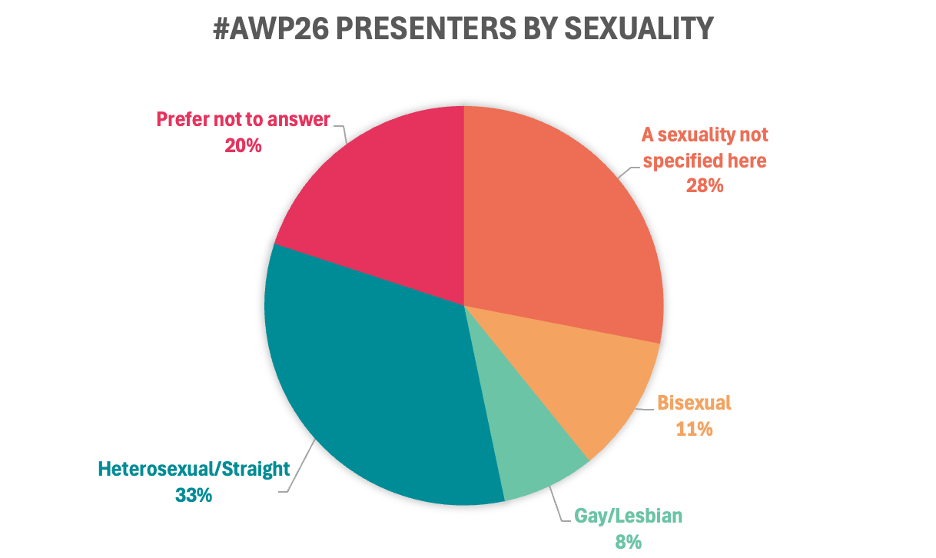
2026 Presenters Who Identified Themselves by Sexual Orientation*
|
Sexual Orientation |
# of Presenters |
|
A sexuality not specified here |
368 |
|
Bisexual |
146 |
|
Gay/Lesbian |
99 |
|
Heterosexual/Straight |
437 |
|
Prefer not to answer |
262 |
|
Grand Total |
1312 |
* Statistics reflect an 89.0% response rate. Of 1,474 presenters, 1,312 responded to the sexuality demographics question. Presenters that selected “prefer not to answer” were figured as respondents.
2026 Not-Accepted vs. Accepted Participants by Sexual Orientation*
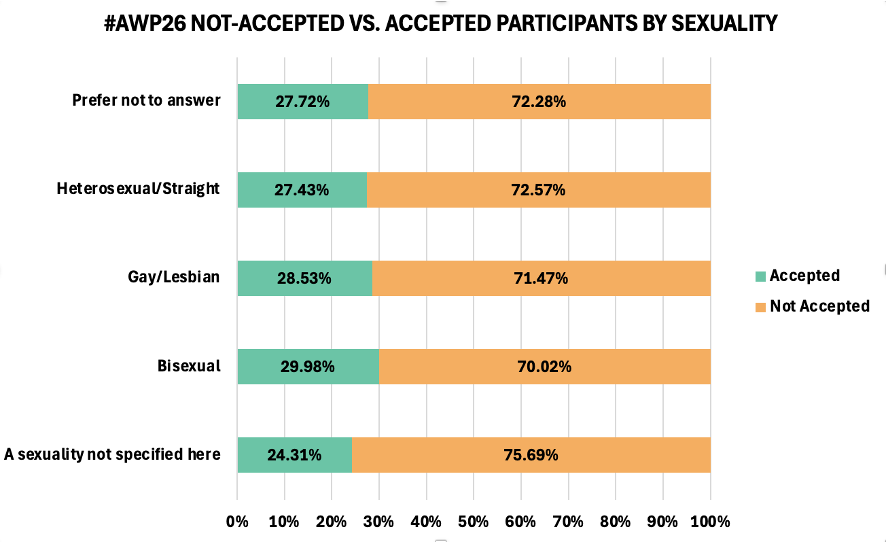
* Statistics reflect an 89.0% response rate for accepted participants (1,312 respondents out of 1,474 accepted participants) and an 85.6% response rate for not-accepted participants (3,574 respondents out of 4,176 not-accepted participants). Participants who selected “prefer not to answer” were figured as respondents.
2026 Presenters by Sexual Orientation, Compared to 2023–2025*
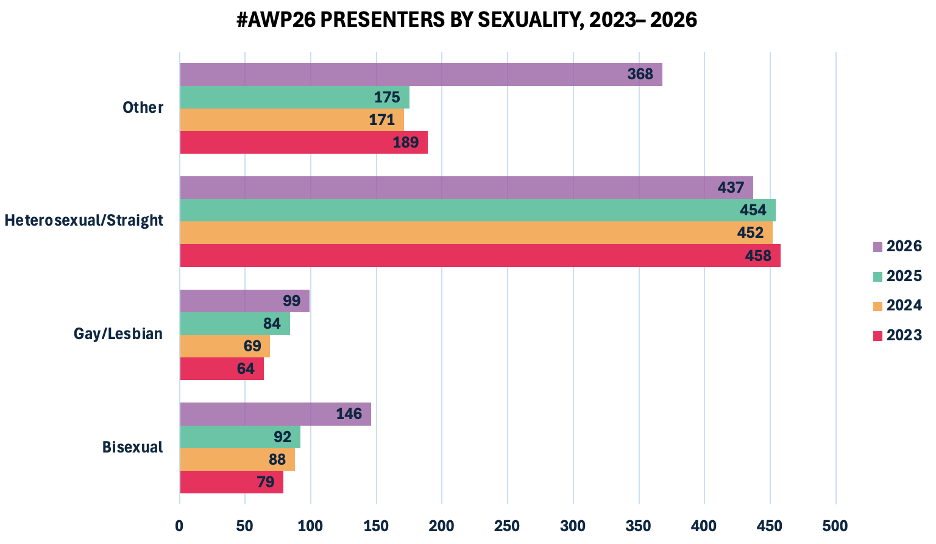
* Statistics reflect the following response rates:
79.1% response rate in 2026
58.9% response rate in 2025
58.9% response rate in 2024
57.6% response rate in 2023
2026 Presenters Who Identified Themselves by Disability*
|
Disability |
# of Presenters |
|
Behavioral disability |
73 |
|
Developmental disability |
13 |
|
I do not have a disability |
678 |
|
Physical disability |
47 |
|
Prefer not to answer |
285 |
|
Sensory disability |
17 |
|
Two or more disabilities |
34 |
|
Grand Total |
1147 |
* Statistics reflect a 77.8% response rate. Of 1,474 presenters, 1,147 responded to the disability demographics question. Presenters that selected “prefer not to answer” were figured as respondents.
2026 Not-Accepted vs. Accepted Participants by Disability*
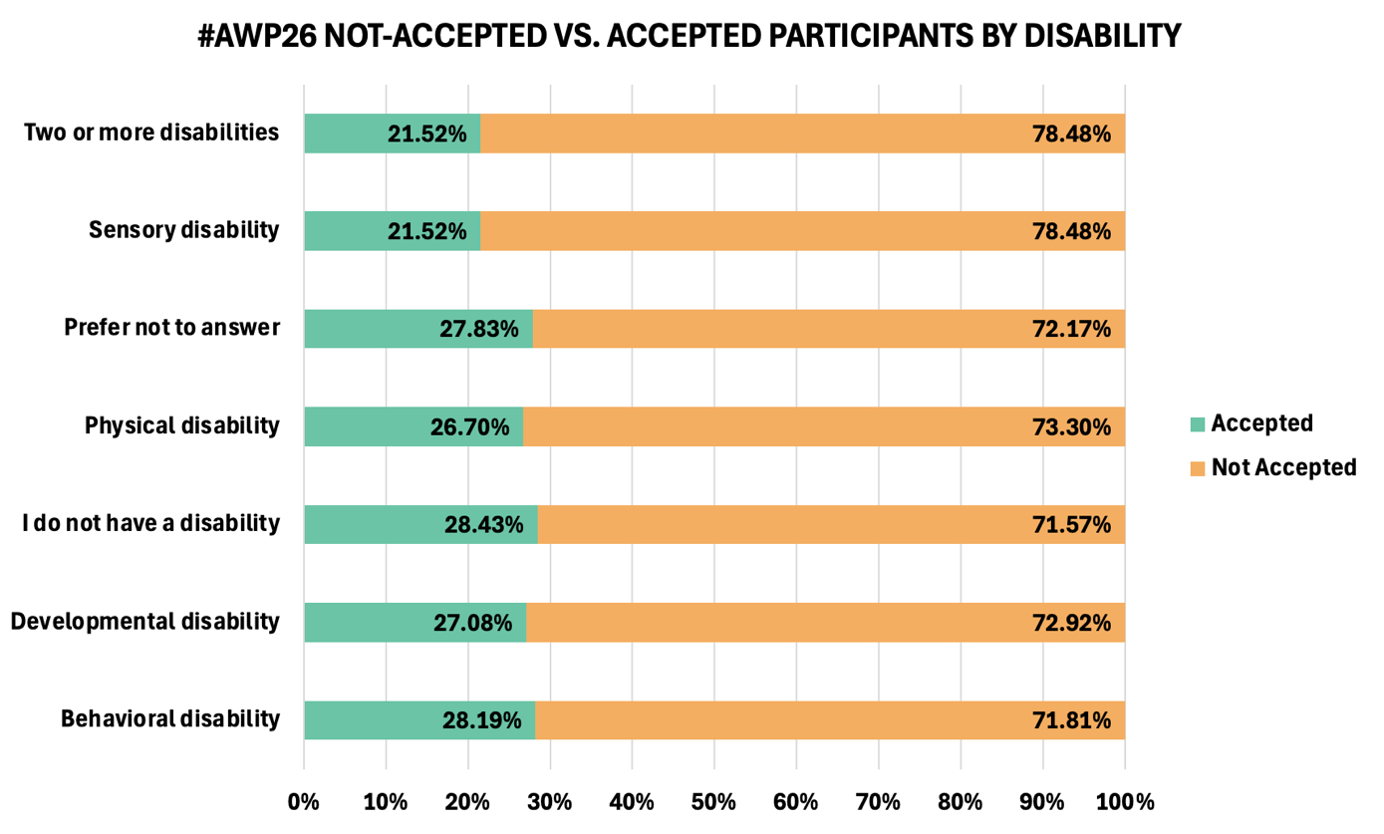
* Statistics reflect a 77.8% response rate for accepted participants (1,147 respondents out of 1,474 accepted participants) and a 71.4% response rate for not-accepted participants (2,982 respondents out of 4,176 not-accepted participants). Participants who selected “prefer not to answer” were figured as respondents.
2026 Presenters by Disability Status, Compared to 2023–2025*
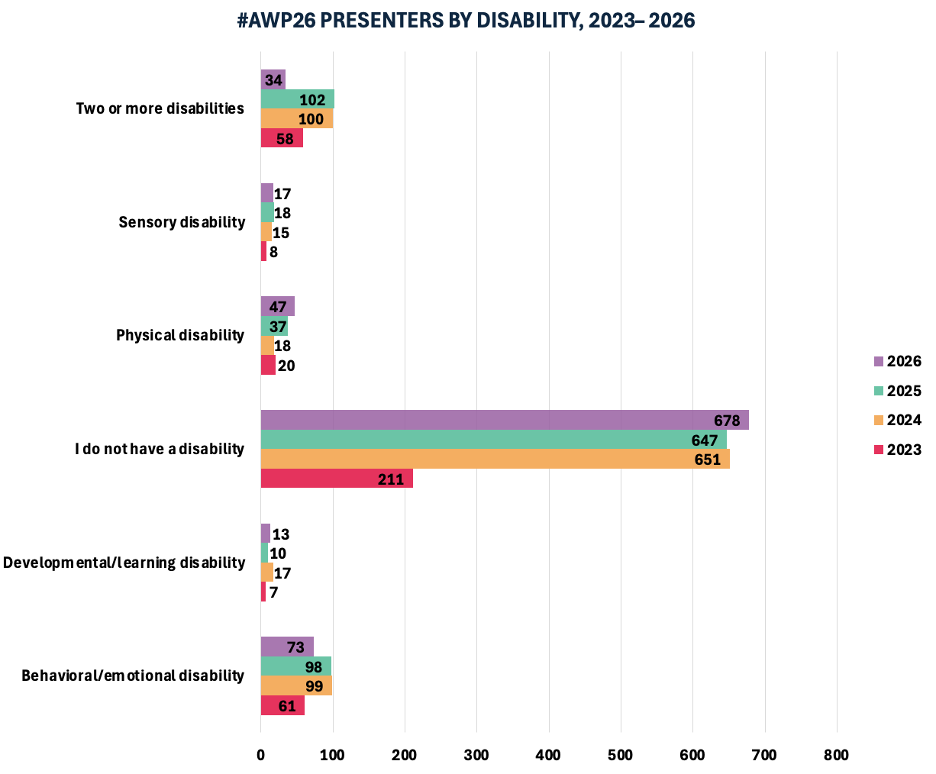
* Statistics reflect the following response rates:
77.8% response rate in 2026
58.1% response rate in 2025
60.5% response rate in 2024
26.5% response rate in 2023
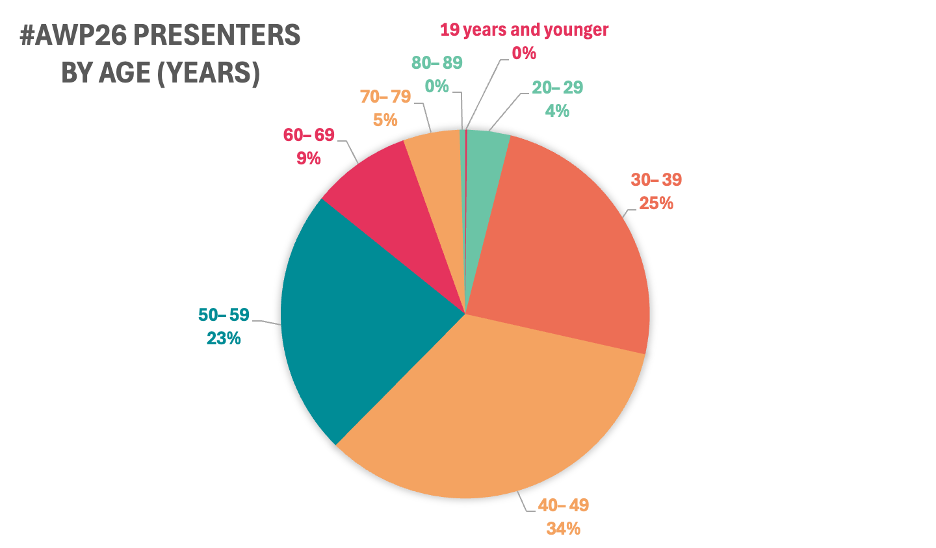
2026 Presenters Who Identified Themselves by Age*
|
Age |
# of Presenters |
|
19 years and younger |
2 |
|
20–29 years |
46 |
|
30–39 years |
297 |
|
40–49 years |
410 |
|
50–59 years |
283 |
|
60–69 years |
106 |
|
70–79 years |
60 |
|
80–89 years |
6 |
|
Grand Total |
1210 |
* Statistics reflect an 82.1% response rate. Of 1,474 presenters, 1,210 responded to the age demographics question.
2026 Not-Accepted vs. Accepted Participants by Age*
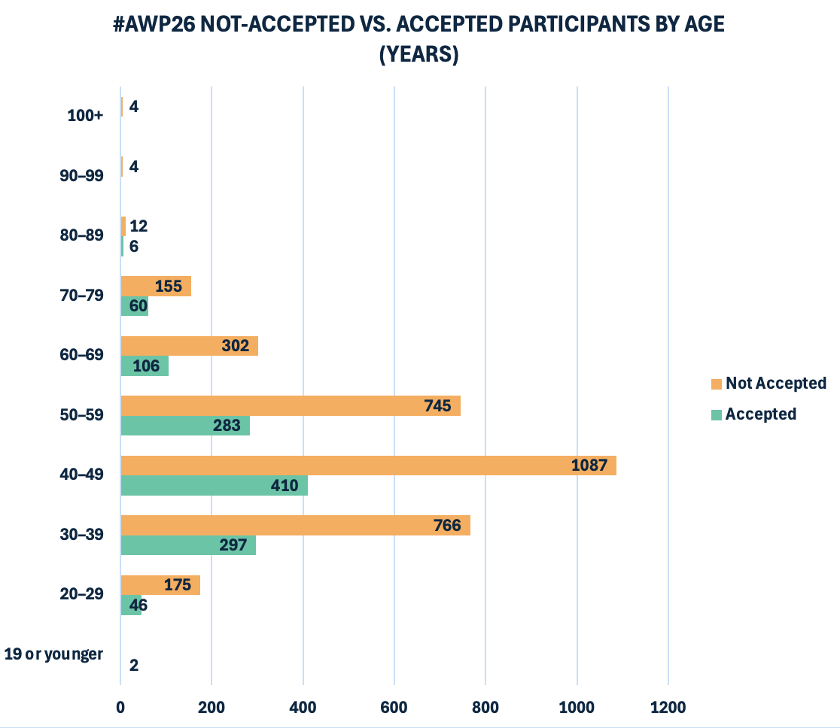
* Statistics reflect an 82.1% response rate for accepted participants (1,210 respondents out of 1,474 accepted participants) and a 77.8% response rate for not-accepted participants (3,250 respondents out of 4,176 not-accepted participants).
2026 Presenters by Age, Compared to 2023–2025*
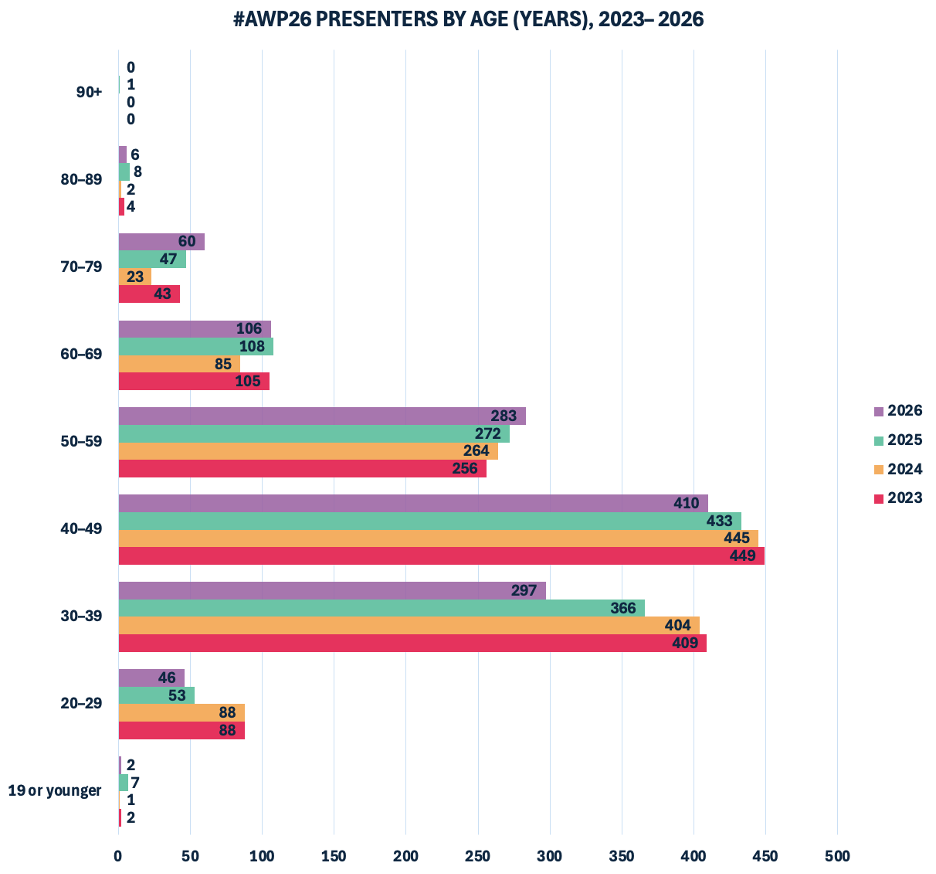
* Statistics reflect the following response rates:
82.1% response rate in 2026
81.8% response rate in 2025
83.5% response rate in 2024
86.0% response rate in 2023


